WELCOME TO BANKINGSTRATEGIST.COM
Data and analytics for community bankers
BankingStrategist.com provides data and analysis on key topics impacting the community banking industry. The information is presented in various forms from tables to graphs and maps (Click on any image to enlarge). BankingStrategist.com provides a unique and different view on various planning processes and on key information covering important topics to supplement your analysis, including:
INDUSTRY CONSOLIDATION |
STRATEGIC PLANNING CONCEPTS |
ECONOMIC & HOUSING DATA |
|
|
|
These dashboards and reports are for your information and use. Examples are shown below with links to appropriate website sections.
We hope that you find several of these beneficial to your strategic planning, ALCO and business planning efforts. We can assist you as you have topics under review relevant to your bank. Who uses this information and data: Community Banks, vendors and other partners to the Community Banking segment, bank analysts, university students and others.
For further information, inquiries on data OR requests for analysis or DISCUSSION,
please contact BankingStrategist.
|
|
Latest 4 Quarters: 2.5%Since 1990: 3.6% L4Q Q4 2023
|
Latest 4 Quarters: 2.3%Since 1990: 4.4% L4Q Q4 2023
|
|
|
Latest 4 Quarters: 4.8%Since 1990: 21.3% L4Q Q4 2023
|
Latest 4 Quarters: 0.1%Since 1990: 0.3% L4Q Q4 2023
|

SELECTIVE BANKING INDUSTRY DATA AND ANALYTICS FOR COMMUNITY BANKERS
BANK ANALYTICS |
| Current and historical data and trends; and analysis on the banking industry, including Community Banks. (Link) |

Balance Sheet Dashboard - Weekly
Bank Loan Trends - Weekly

Bank Loan Quality Dashboard - Quarterly
BALANCE SHEET TRENDS |
| Quarterly analysis of trends, segmented by bank asset size, in total assets, loans, deposits, equity and other key balance sheet categories. (Link) |
Total Assets by Bank Size
Total Loans by Bank Size
Total Deposits by Bank Size
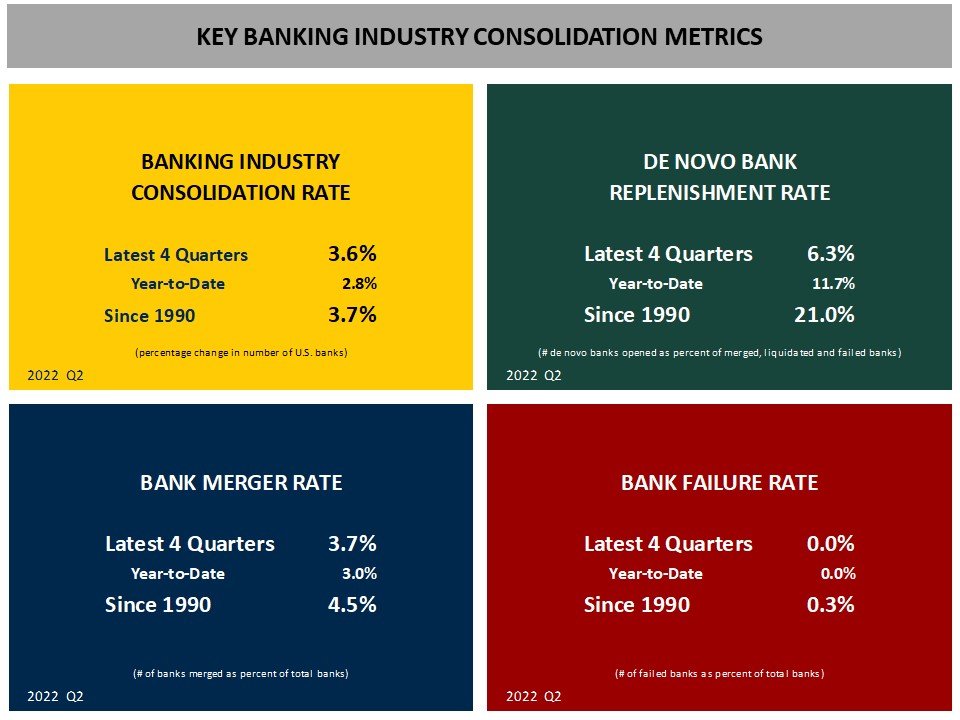
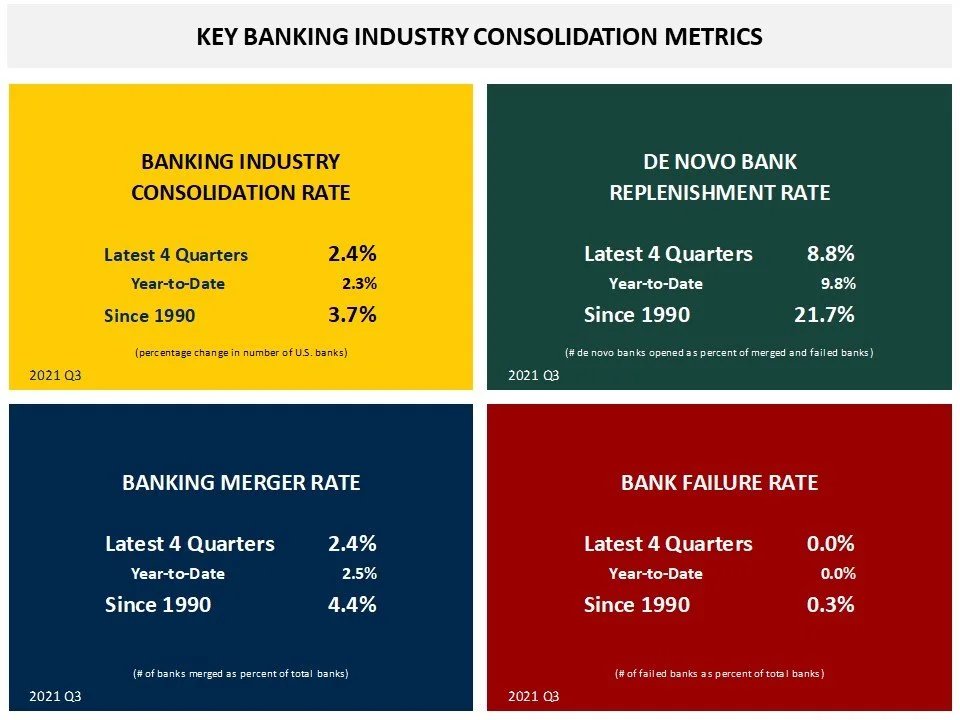
INDUSTRY CONSOLIDATION |
| Banking industry consolidation trends continue. The Banking Industry Consolidation Rate represents the percentage decline in the number of banks from one year ago. (Link) |
Banking Industry Consolidation Rate
Year-over-Year Change in Charters
Change in Charters by Bank Size
DE NOVO BANKING TRENDS |
| While historically an important element of banking, de novo bank chartering activity has reached historic lows. The De Novo Bank Replenishment Rate represents the percentage of de novo banks that are opened compared to the number of banks that have merged or failed. (Link) |
Trends in FDIC De Novo Bank Activity Since 2000
De Novo Bank Replenishment Rate Since 2000
De Novo Bank Activity Since 2017
COMMUNITY BANKING TRENDS |
| Community Banks are found across the U.S. And, importantly, Community Banks are primary financial institutions in rural and smaller markets. M&A activity continues to impact number of community banks. (Link) |
Community Banks by State
Community Bank Charters YoY
Community Banks & Market Size
BANK MERGERS |
| Bank mergers have been an important strategy used by banks of all sizes and across the U.S. While there have been cycles, bank merger activity has been ongoing. (Link) |
Trends in Bank Mergers
Recent U.S. Bank Merger Activity
Bank Merger Activity
BANK FAILURES |
| Bank failures have surfaced in cycles and driven by specific asset or loan issue: oil, commercial real estate, residential real estate, etc. Or sometimes more one-off resulting from insider or outsider fraud. (Link) |
Recent Bank Failures
Bank Failure Rate by Year
11/3/2023
Citizens Bank
FEDERAL HOME LOAN BANKS |
| Overview and history of the Federal Home Loan Bank system, membership, advance activity, affordable housing program and other information. (Link) |
FHLBank Members by Type
Trends in Advances
FHLBanks - Lenders During Crisis
BANK PLANNING |
| Concepts, approaches, timelines and issues relevant to your various long range and strategic planning efforts. (Link) |
Bank Capital Planning Approach

Bank Strategic Planning Calendar

Bank Merger Timeline Example
ECONOMIC DATA, REPORTS AND ANALYTICS FOR COMMUNITY BANKERS
ECONOMICS |
| Economic dashboards, data and analysis on interest rates, Fed monetary policy, GDP, labor markets and international trade to support your bank’s long range, capital and other planning activities. (Link) |
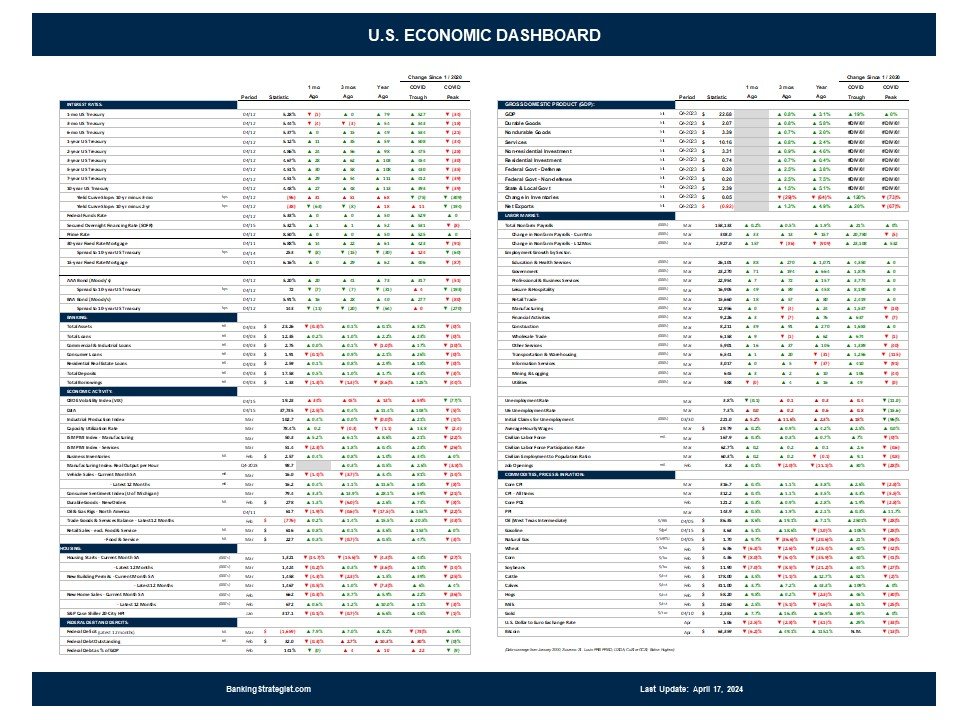
U.S. Economic Dashboard

GDP Dashboard

Labor Market Dashboard
ECONOMICS - MIDWEST |
|
Economic dashboards for selected Midwestern states to support your bank’s ALCO and other planning activities.
Currently dashboards for several Midwest states: Illinois, Indiana, Michigan, Ohio and Wisconsin are available. Click on the image to open your PDF copy. (Link) |

Midwest Economic Review
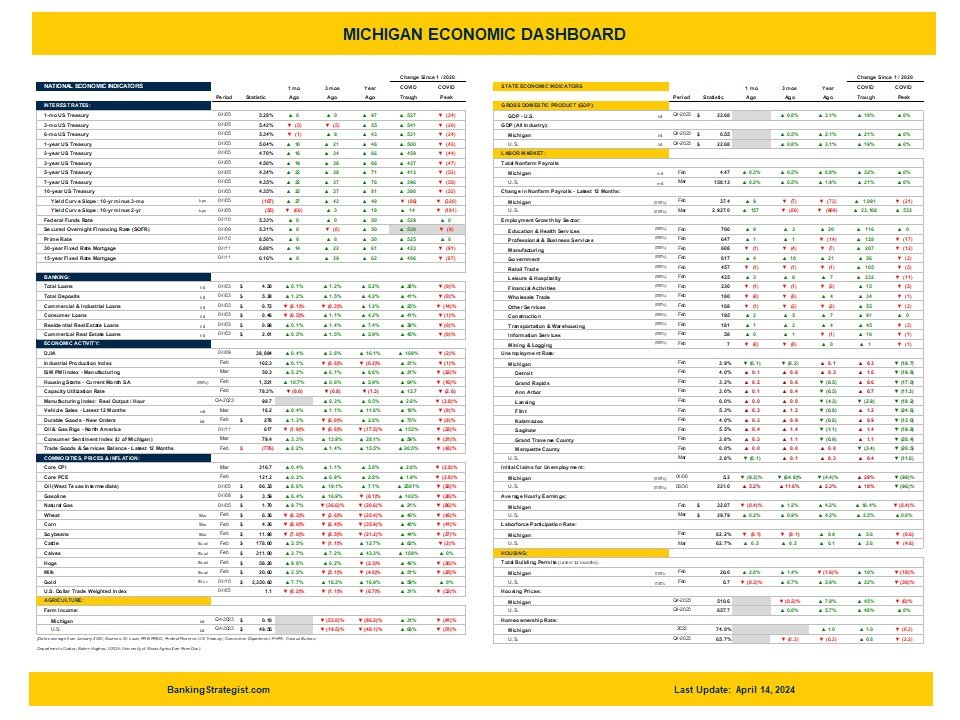
Michigan Economic Dashboard

Illinois Economic Dashboard
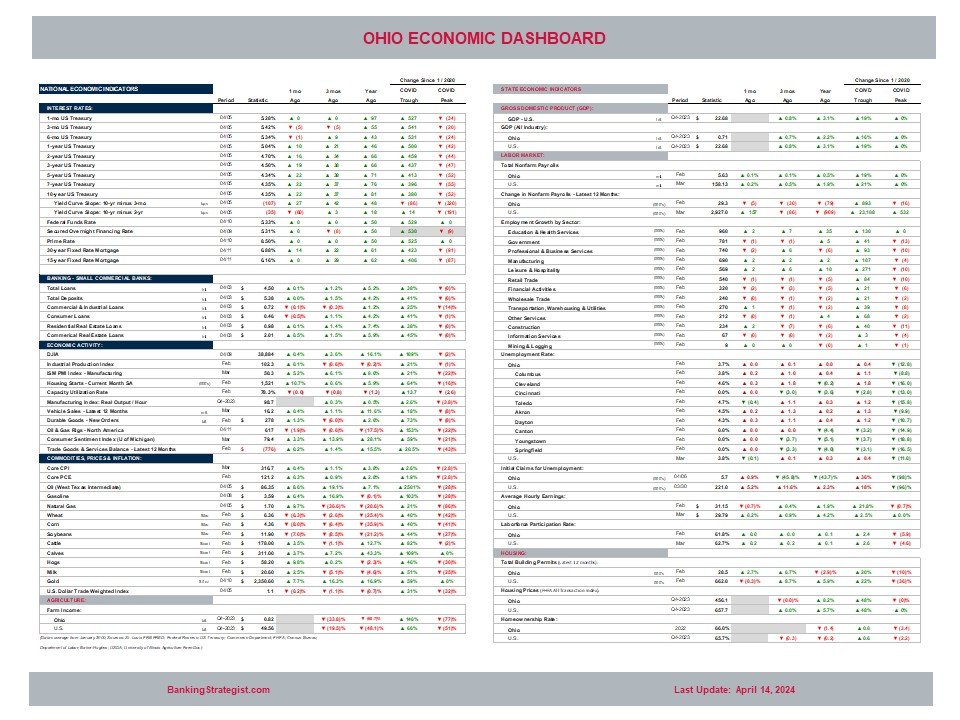
Ohio Economic Dashboard

Indiana Economic Dashboard

Wisconsin Economic Dashboard
GDP & ECONOMIC GROWTH |
| Current and historical data and trend charts on Gross Domestic Product and key components. (Link) |
GDP Components.
GDP: QoQ Growth (annualized)
Historical Trends in GDP.
INFLATION |
| Current and historical data and trend charts on inflation. (Link) |
Core PCE = Personal Consumption Expenditures, excluding food and energy items.
CPI - Consumer Price Index.
Inflation Measures.
INTEREST RATE TRENDS |
| Current and historical data and trend charts on U.S. Treasury rates and spreads. (Link) |
Yield Curve YoY Change
COVID-19 Crisis & Taming Inflation
Yield Curve Trends Latest 3 Years
SHORT TERM INTEREST RATES |
| Current and historical data and trend charts on bank prime rate, commercial paper rate and secured overnight financing rate (SOFR). (Link) |
Bank Prime and SOFR Rates
Secured Overnight Financing Rate (SOFR)
Commercial Paper Rate
CONSUMERS |
| Current and historical data and trend charts on employment, personal income, spending, sentiment and borrowings. (Link) |

Personal Income

Consumer Spending

Credit Card and Revolving Credit Debt
CORPORATE BOND MARKETS |
| Current and historical data and trend charts on corporate bonds outstanding, issuance, yield curve and risk premiums. (Link) |
Corporate Bond Issuance and Outstanding
Aaa Corporate Bond Yield and Spread
Corporate Bond Yield Curve and Risk Premium
FED MONETARY POLICY |
| Data and analysis of Federal Reserve programs supporting monetary policy goals through interest rates and its balance sheet. (Link) |
Federal Funds Rate Phases
Fed Balance Sheet Composition
Fed Balance Sheet Trends
FEDERAL FISCAL POLICY |
| Data and analytics on federal spending, receipts, debt outstanding, foreign, Federal Reserve and other investors in U.S. government securities. (Link) |
Federal Spending and Revenues
Federal Surplus (Deficit) Spending
U.S. Treasuries Debt Outstanding
HOUSING SECTOR |
| Current and historical data, trends and analysis on the housing sector and mortgage finance markets, including interest rates, housing prices, housing starts and sales and other statistics. (Link) |

U.S. Housing & Mortgage Finance Dashboard
Housing Price Trends
Housing Starts Trends
Single-family Residential Mortgages: $13 trillion outstanding.
Home “P/E” Ratios (Home prices as multiple of family income)
Mortgage Interest Rates
INTERNATIONAL TRADE |
| Data and analysis on international trade, agricultural exports and foreign exchange rate trends. (Link) |

International Trade Dashboard
LTM Net Goods & Services
Foreign Exchange Rates
LABOR MARKET |
| Data and analysis on labor market conditions in U.S. and key statistics for states. (Link) |
Trends in Job Growth
Unemployment Rates
COVID Job Loss - Quarterly Recovery Trends
Job Loss and Recovery by Type
Job Loss and Recovery - Top 15 States
Initial Claims for Unemployment and Continuing Claims - Weekly